
Gantt
The Gantt tab shows a Gantt diagram of “activities”, an activity is typically a task or reserved space for a task. The Gantt diagram is a functionality that must be enabled by Ventu.
Activities may depend on other activities, eg. the activity “Get building permission” should not be started before the activity “Survey” has complete. Activities may be grouped, in the example below the “Planning phase” activity is a group with two sub-activities: “Survey” and “Get building permission”.
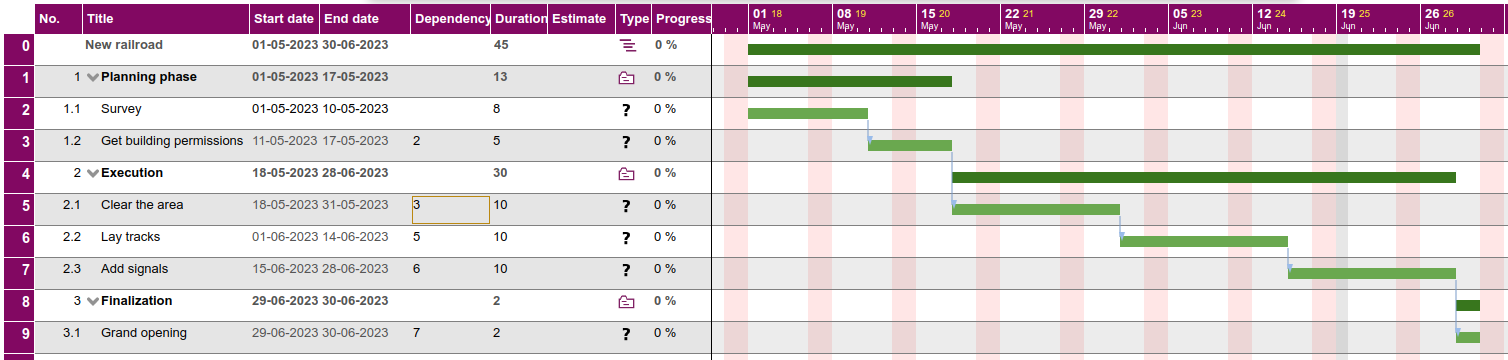
The left side shows various fields from the activities; you may edit some of the fields simply by clicking or double-clicking on them. You can navigate between the fields using the keyboard.
The right side shows the Gantt diagram, with arrows between the activities where there are dependencies. When you change dates or dependencies in the left side the right side is updated.
Editing
The various fields can be edited by clicking or double-clicking on them.
Title: double-click to edit the text, press Enter when done
Start date / End date: click on the field to select a date
Dependency: right-click to bring up a dialog where you can select the dependencies
Duration: double-click to enter the expected duration in days of the activity
Estimate: double-click to enter the estimate (hours/minutes) for the task
Type: right-click to bring up a menu where you can change the type of the activity
You may right-click on the No. or Title fields (and some other fields) to bring up a menu allowing to add, insert and delete activities. You may drag the leftmost purple column up/down to change the order of the activities.
Planning
You may right-click on an task-activity in the right side, to bring up a menu from where you can select Users. This will bring up a dialog where you may plan the task.
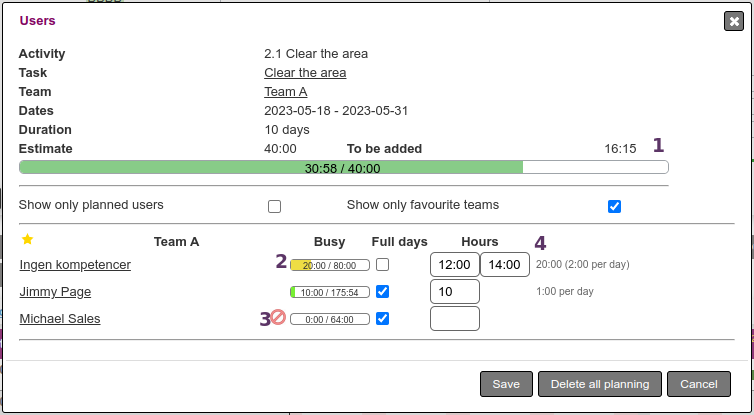
A few fields need an explanation:
(1) To be added: This is the sum of the hours (4) that you have entered but not yet saved.
(2) Busy: The busy indicator shows the hours planned for the user vs. the total work time of the user in the period. Hours that have been entered in (4), but not yet saved, are included in the planned hours. Hold the mouse over the busy indicator to get a summary.
(3) The red icon indicates that the user is not at work on one or more of the days in the period.
(4) Hours: If the Full days checkbox is checked then you can specify the total number of hours the user should be allocated to this task - this will be split over the work days. If the Full days is not marked then you can specify the part of the day where the user should be planned - this applies to all work days.
The yellow star to the left of a team name is used to indicate that a team is a favourite team.
Toolbar
The toolbar above the Gantt diagram contains a number of tools:

Zoom in / Zoom out : changes the scale of the Gantt diagram
Today : moves the Gantt diagram to show today
Columns: allows you to select which columns should be included in the left side
Setup: setup colours for the Gantt diagram and which information to show in the Gantt diagram
Tasks: shows a list of tasks that belong to the project but are not included as an activity; you can select a task and that way add it as an activity
Appointments: shows a list of appointments that relate to the project but are not included as activities; you can select an appointment and that way add it as an activity
Move: this moves all activities
Save backup / Reload backup: this saves 7r reloads a backup of the activities, this is useful when experimenting; this is only available if you are in the adminstrator mode
PDF : save a PDF of the Gantt diagram
Help: show a dialog with a list of keyboard shortcuts