
Statistics
In here you can generate statistics for the work plan in any period you wish, and for any team.
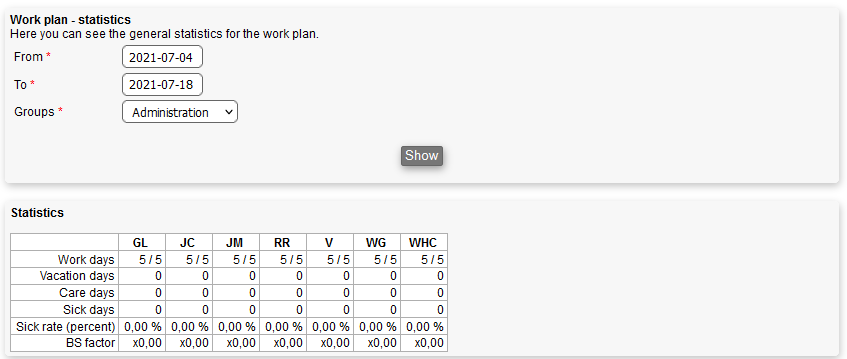
The statistics that are generated for your analysis, are as follows:
- Work days: Shows you how many of the total work days in the chosen period of time, every employee (i.e. each column) have been to work
- Vacation days: Shows you how many vacation days each employee have taken in the chosen period of time
- Care days: Shows you how many care days each employee have taken in the chosen period of time
- Sick days: Shows you how many sick days each employee have taken in the chosen period of time
- Sick rate (percent): Shows you the sick rate percentage of each employee in the chosen period of time
- BS factor: Shows you how each employee's sick days are distributed in comparison to his/her working days. A number around x1.00 suggests that they are distributed normally, while a number closing in on x2.00 or more indicates that the employee's sick days has a tendency to revolve around the same days, e.g. weekends and vacations. Notice that the BS factor can produce huge spikes, if only short periods of time are considered. Therefore, it should be considered over several months in order to give a more accurate picture
Furthermore, it is possible to generate reports from the Work plan module, which is done through the Report module.